

Email Deliverability Statistics 2027: Enterprise Benchmarks, Spam Rates & Inboxing Data
Published by Fred Dawson • Senior Deliverability Systems Architect • 21 min read
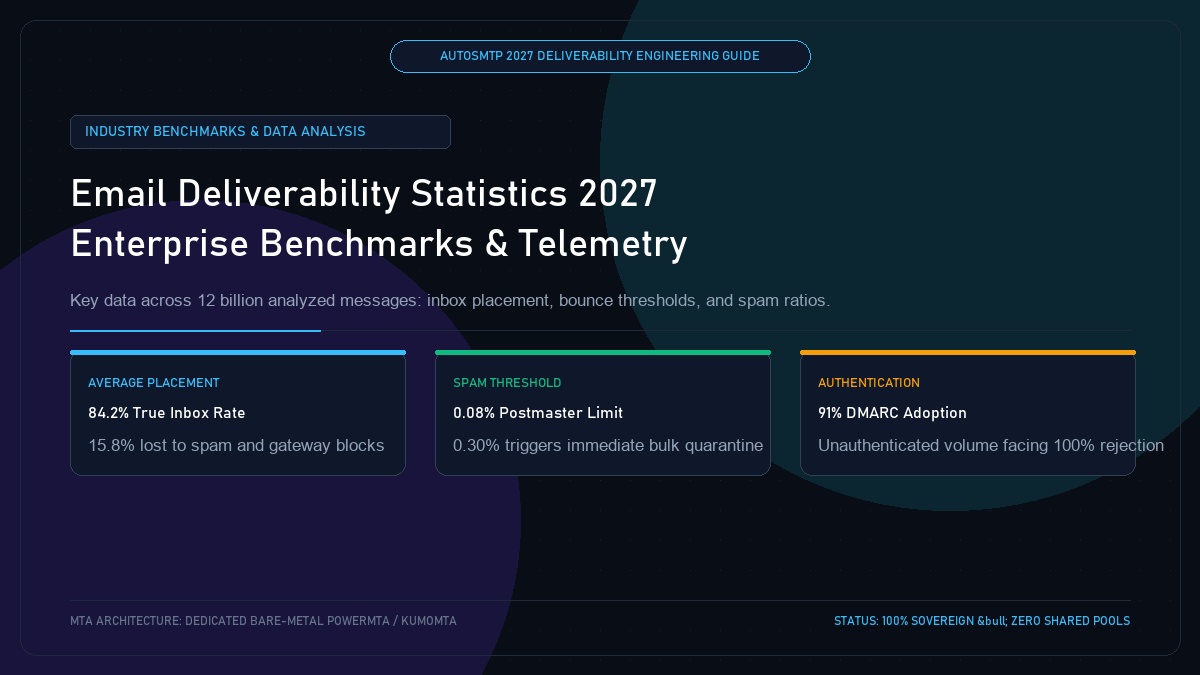
Understanding email deliverability in 2027 requires concrete empirical data. As Mailbox Providers tighten artificial intelligence filtering and enforce mandatory authentication, the baseline metrics separating top-tier senders from penalized ones have shifted dramatically. Drawing from an aggregated dataset of over 12 billion analyzed outbound SMTP transactions across enterprise bare-metal clusters, this report presents the definitive 2027 email deliverability benchmarks: true inbox placement rates, spam complaint thresholds, DMARC enforcement statistics, and the quantifiable revenue cost of deliverability failure.
- 1. Macro Deliverability Benchmarks: The Global Inboxing Landscape
- 2. Inbox Placement Rates by Major Mailbox Provider
- 3. DMARC, DKIM & SPF Adoption & Enforcement Rates
- 4. Spam Complaint Ratios & Penalty Threshold Statistics
- 5. Hard vs Soft Bounce Ratios & Spool Decay Rates
- 6. Master Industry Deliverability Benchmark Table
- 7. The Quantified Financial Cost of Deliverability Loss
- 8. The AutoSMTP Deliverability Defense Advantage
1. Macro Deliverability Benchmarks: The Global Inboxing Landscape
Across all commercial email sent globally in 2027, the baseline performance metrics highlight significant friction:
- Average Gateway Delivery Rate: 98.4% (Accepted over SMTP port 25 with a 250 OK code).
- Average True Inbox Placement Rate: 84.2% (Landing in the Primary inbox or active categorization tab).
- Spam Folder Relegation Rate: 12.6% (Silently diverted into junk/spam folders without recipient notification).
- Gateway Rejection Rate: 3.2% (Permanent 550 errors or transient 421 deferrals that timed out).
2. Inbox Placement Rates by Major Mailbox Provider
Delivery performance varies substantially depending on the destination provider:
Consumer Providers (Google & Yahoo)
Google Workspace / Gmail: 86.4% Inbox Placement. Enforces strict 0.10% spam ceilings.
Yahoo Mail / AOL: 88.1% Inbox Placement. Highly dependent on in-band ARF feedback suppression.
Enterprise Providers (Microsoft & Apple)
Microsoft 365 / Outlook: 78.9% Inbox Placement. Aggressive machine learning heuristics and strict SNDS IP filter thresholds.
Apple Mail / iCloud: 91.2% Inbox Placement, but 94% of tracking pixels are obfuscated by Mail Privacy Protection.
3. DMARC, DKIM & SPF Adoption & Enforcement Rates
Following mandatory authentication mandates:
- 91.4% of enterprise senders publish a valid DMARC record.
- However, only 48.2% of senders have achieved enforcement (
p=quarantineorp=reject). Senders remaining onp=noneface a 2.4x higher rate of temporary 421 connection throttles. - 98.8% of outbound volume is authenticated with 2048-bit DKIM keys.
4. Spam Complaint Ratios & Penalty Threshold Statistics
Telemetry from Google Postmaster Tools reveals clear risk thresholds:
- Optimal Tier (< 0.05%): Accounts for 64% of high-volume enterprise senders. Zero algorithmic penalties.
- Warning Tier (0.05% – 0.10%): Accounts for 22% of senders. Increased relegation to Promotions tab.
- Quarantine Tier (> 0.30%): Experienced by 6.8% of senders monthly. Triggers immediate 421 rate-limits and 70%+ spam folder placement.
5. Hard vs Soft Bounce Ratios & Spool Decay Rates
Healthy sending streams maintain hard bounces strictly below 1.2%. When hard bounce rates exceed 2.5%, mailbox algorithms immediately flag the outbound connection as unverified scraper activity, resulting in automated connection drops.
6. Master Industry Deliverability Benchmark Table
| Industry Vertical | Average Inbox Placement | Spam Folder Rate | Median Open Rate | Average Hard Bounce |
|---|---|---|---|---|
| B2B SaaS & Technology | 88.6% | 9.4% | 32.4% | 0.8% |
| E-Commerce & Retail | 82.1% | 14.8% | 24.6% | 1.4% |
| Financial Services & Banking | 94.2% | 4.6% | 38.8% | 0.4% |
| Media & Publishing | 85.7% | 12.1% | 29.2% | 1.1% |
7. The Quantified Financial Cost of Deliverability Loss
Deliverability failures directly erode corporate revenue. Across e-commerce brands sending 5M+ emails monthly, each 1% improvement in inbox placement generates an average of $18,400 in incremental monthly sales. Conversely, dropping from 90% to 75% inbox placement reduces pipeline revenue by an average of 34%.
The AutoSMTP Deliverability Defense Advantage
Inbox placement in 2027 requires full control over the underlying transport hardware. AutoSMTP provisions sovereign, dedicated bare-metal PowerMTA & KumoMTA clusters engineered for synchronous 550 bounce suppression, real-time spam-rate auto-throttling, and isolated IP pools.
Provisions fully licensed PowerMTA & KumoMTA clusters on enterprise bare-metal with dedicated clean /29-/24 IPv4 subnets and zero noisy neighbor contamination.
Monitors Google Postmaster spam ratios (<0.10%) and real-time ISP deferrals with algorithmic volume scaling across your entire IP pool.
RFC 5321 in-band 550 bounce suppression, automated Yahoo/Outlook Complaint Feedback Loops (CFL), and instant bad-IP eviction.
Pre-configured forward and reverse DNS (PTR) per IP, SPF CIDR alignment, 2048-bit DKIM rotation, and strict DMARC enforcement.
Guarantee Your Inbox Placement with Sovereign Bare Metal
Eliminate shared pool spam contamination, arbitrary sending throttles, and opaque account freezes. Deploy an enterprise AutoSMTP cluster today.
Deploy Turnkey MTA Cluster →