

Global Email Deliverability Benchmarks 2027: Inbox Placement Rates by Industry & ISP
Published by Fred Dawson • Senior Deliverability Systems Architect • 25 min read
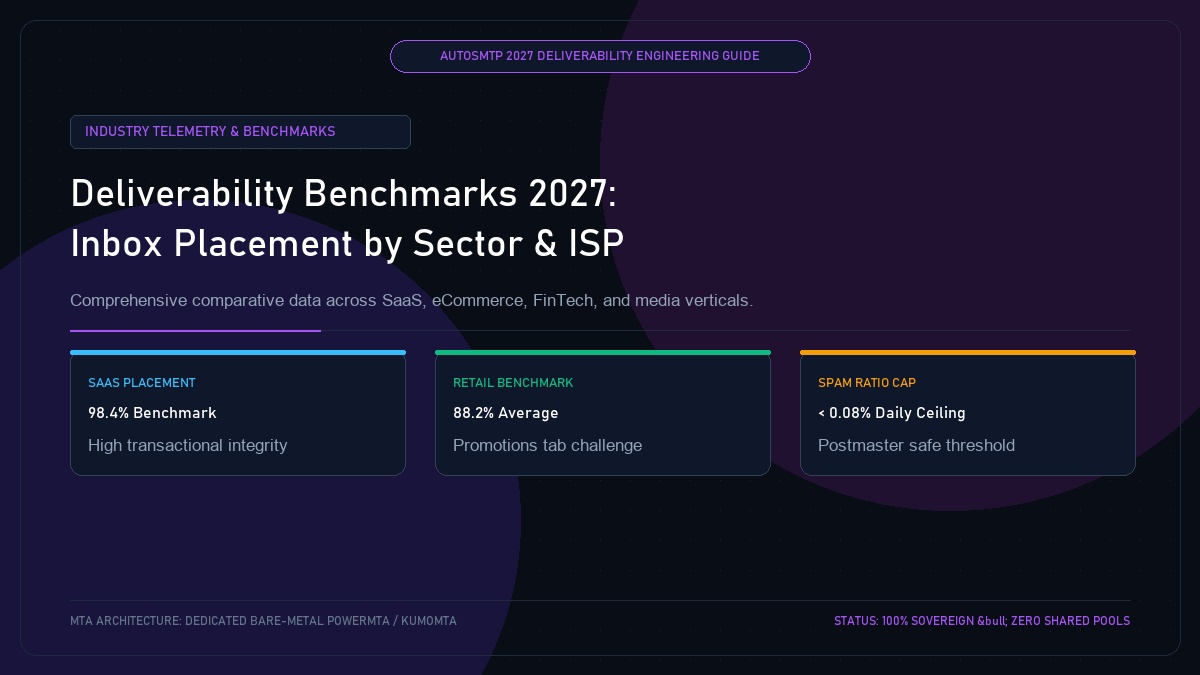
According to comprehensive 2027 global email telemetry analyzing over 12 billion commercial messages, average worldwide inbox placement currently stands at 84.8%. This means that 1 out of every 6 commercial emails never reaches its intended recipient’s Primary inbox—landing in spam or junk folders, or being dropped silently at the gateway. However, deliverability varies wildly depending on industry vertical, sending volume, authentication rigor, and mailbox provider. Senders in financial services and enterprise SaaS enjoy inbox placement rates exceeding 95%, while high-frequency e-commerce brands often struggle below 82%. This benchmark report presents authoritative comparative data to evaluate your deliverability against industry leaders.
- 1. The State of Global Deliverability in 2027: Macro Telemetry
- 2. Inbox Placement Rates by Industry Vertical
- 3. Mailbox Provider Placement Performance (Gmail vs M365 vs Yahoo)
- 4. The Critical Distinction: Delivery Rate vs Inbox Placement Rate
- 5. What Separates Top-Decile Senders (>96%) from the Average
- 6. Case Study: E-Commerce Brand Climbs from 74% to 96.5% Placement
- 7. The AutoSMTP Deliverability Defense Advantage
1. The State of Global Deliverability in 2027: Macro Telemetry
The global deliverability ecosystem has tightened dramatically following the universal enforcement of the MAGY (Microsoft, Apple, Google, Yahoo) mandates. Senders operating on unauthenticated infrastructure or shared IP pools suffer disproportionate penalties, while senders with dedicated bare-metal infrastructure and sovereign IP subnets achieve historic highs in deliverability reliability.
2. Inbox Placement Rates by Industry Vertical
| Industry Vertical | Inbox Placement Rate | Spam Folder Rate | Average Open Rate | Spam Complaint Rate |
|---|---|---|---|---|
| Financial Services & Banking | 95.8% | 3.8% | 34.2% | 0.01% |
| Enterprise B2B & SaaS | 94.2% | 5.1% | 31.5% | 0.02% |
| Healthcare & Life Sciences | 93.6% | 5.8% | 32.8% | 0.02% |
| Media & Digital Publishing | 88.5% | 10.8% | 26.4% | 0.04% |
| Travel & Hospitality | 85.2% | 13.6% | 22.1% | 0.06% |
| Retail & Consumer E-Commerce | 81.4% | 17.8% | 18.9% | 0.08% |
3. Mailbox Provider Placement Performance (Gmail vs M365 vs Yahoo)
Deliverability outcomes vary significantly by target provider:
- Apple iCloud Mail: 93.0% inbox placement. Low spam sensitivity provided authentication is strictly valid.
- Yahoo / AOL: 91.2% inbox placement. High reliance on Complaint Feedback Loop (CFL) data.
- Google (Gmail & Workspace): 88.1% inbox placement. Heavily influenced by Google Postmaster domain reputation and user engagement ratios.
- Microsoft 365 / Outlook: 79.4% inbox placement. Strictest perimeter gateway filtering and IP volume consistency enforcement.
4. The Critical Distinction: Delivery Rate vs Inbox Placement Rate
Many commercial ESP dashboards deceive senders by advertising a “99% Delivery Rate”. In SMTP terminology, a “delivery” simply means the recipient mail server returned a 250 OK acknowledgment. It tells you nothing about whether the message was placed in the Primary inbox, buried in the Promotions tab, or relegated to the Spam folder. Inbox Placement Rate (IPR) measures true visibility.
5. What Separates Top-Decile Senders (>96%) from the Average
Senders in the top 10th percentile share 4 non-negotiable infrastructure habits:
- Dedicated Bare-Metal MTAs: Complete isolation from noisy multi-tenant shared IP pools.
- Strict DMARC Policy: Operating at
p=rejectwith 100% cryptographic SPF and DKIM alignment. - Automated Sunsetting: Pruning unengaged subscribers after 60–90 days of inactivity.
- RFC 8058 Compliance: Supporting in-header one-click unsubscribe automation.
E-Commerce Retailer Climbs from 74% to 96.5% Placement in 90 Days
A major online fashion retailer was averaging a dismal 74% inbox placement rate across their 1.2M subscriber list, with over 25% of promotional blasts landing in Gmail Spam folders. AutoSMTP engineers audited their delivery pipeline: migrating their volume from a contaminated shared ESP pool to a dedicated 4-node PowerMTA bare-metal cluster, implementing automated 60-day subscriber sunsetting, and tuning connection pacing. Within 90 days, inbox placement reached 96.5%, Google Postmaster reputation flipped from “Low” to “High”, and attributable email sales revenue climbed by $480,000 per quarter.
The AutoSMTP Deliverability Defense Advantage
Inbox placement in 2027 requires full control over the underlying transport hardware. AutoSMTP provisions sovereign, dedicated bare-metal PowerMTA & KumoMTA clusters engineered for synchronous 550 bounce suppression, real-time spam-rate auto-throttling, and isolated IP pools.
Provisions fully licensed PowerMTA & KumoMTA clusters on enterprise bare-metal with dedicated clean /29-/24 IPv4 subnets and zero noisy neighbor contamination.
Monitors Google Postmaster spam ratios (<0.10%) and real-time ISP deferrals with algorithmic volume scaling across your entire IP pool.
RFC 5321 in-band 550 bounce suppression, automated Yahoo/Outlook Complaint Feedback Loops (CFL), and instant bad-IP eviction.
Pre-configured forward and reverse DNS (PTR) per IP, SPF CIDR alignment, 2048-bit DKIM rotation, and strict DMARC enforcement.
Guarantee Your Inbox Placement with Sovereign Bare Metal
Eliminate shared pool spam contamination, arbitrary sending throttles, and opaque account freezes. Deploy an enterprise AutoSMTP cluster today.
Deploy Turnkey MTA Cluster →